Infographic: Rounding the Peak on Carbon Emissions
Infographic: Rounding the Peak on Carbon Emissions

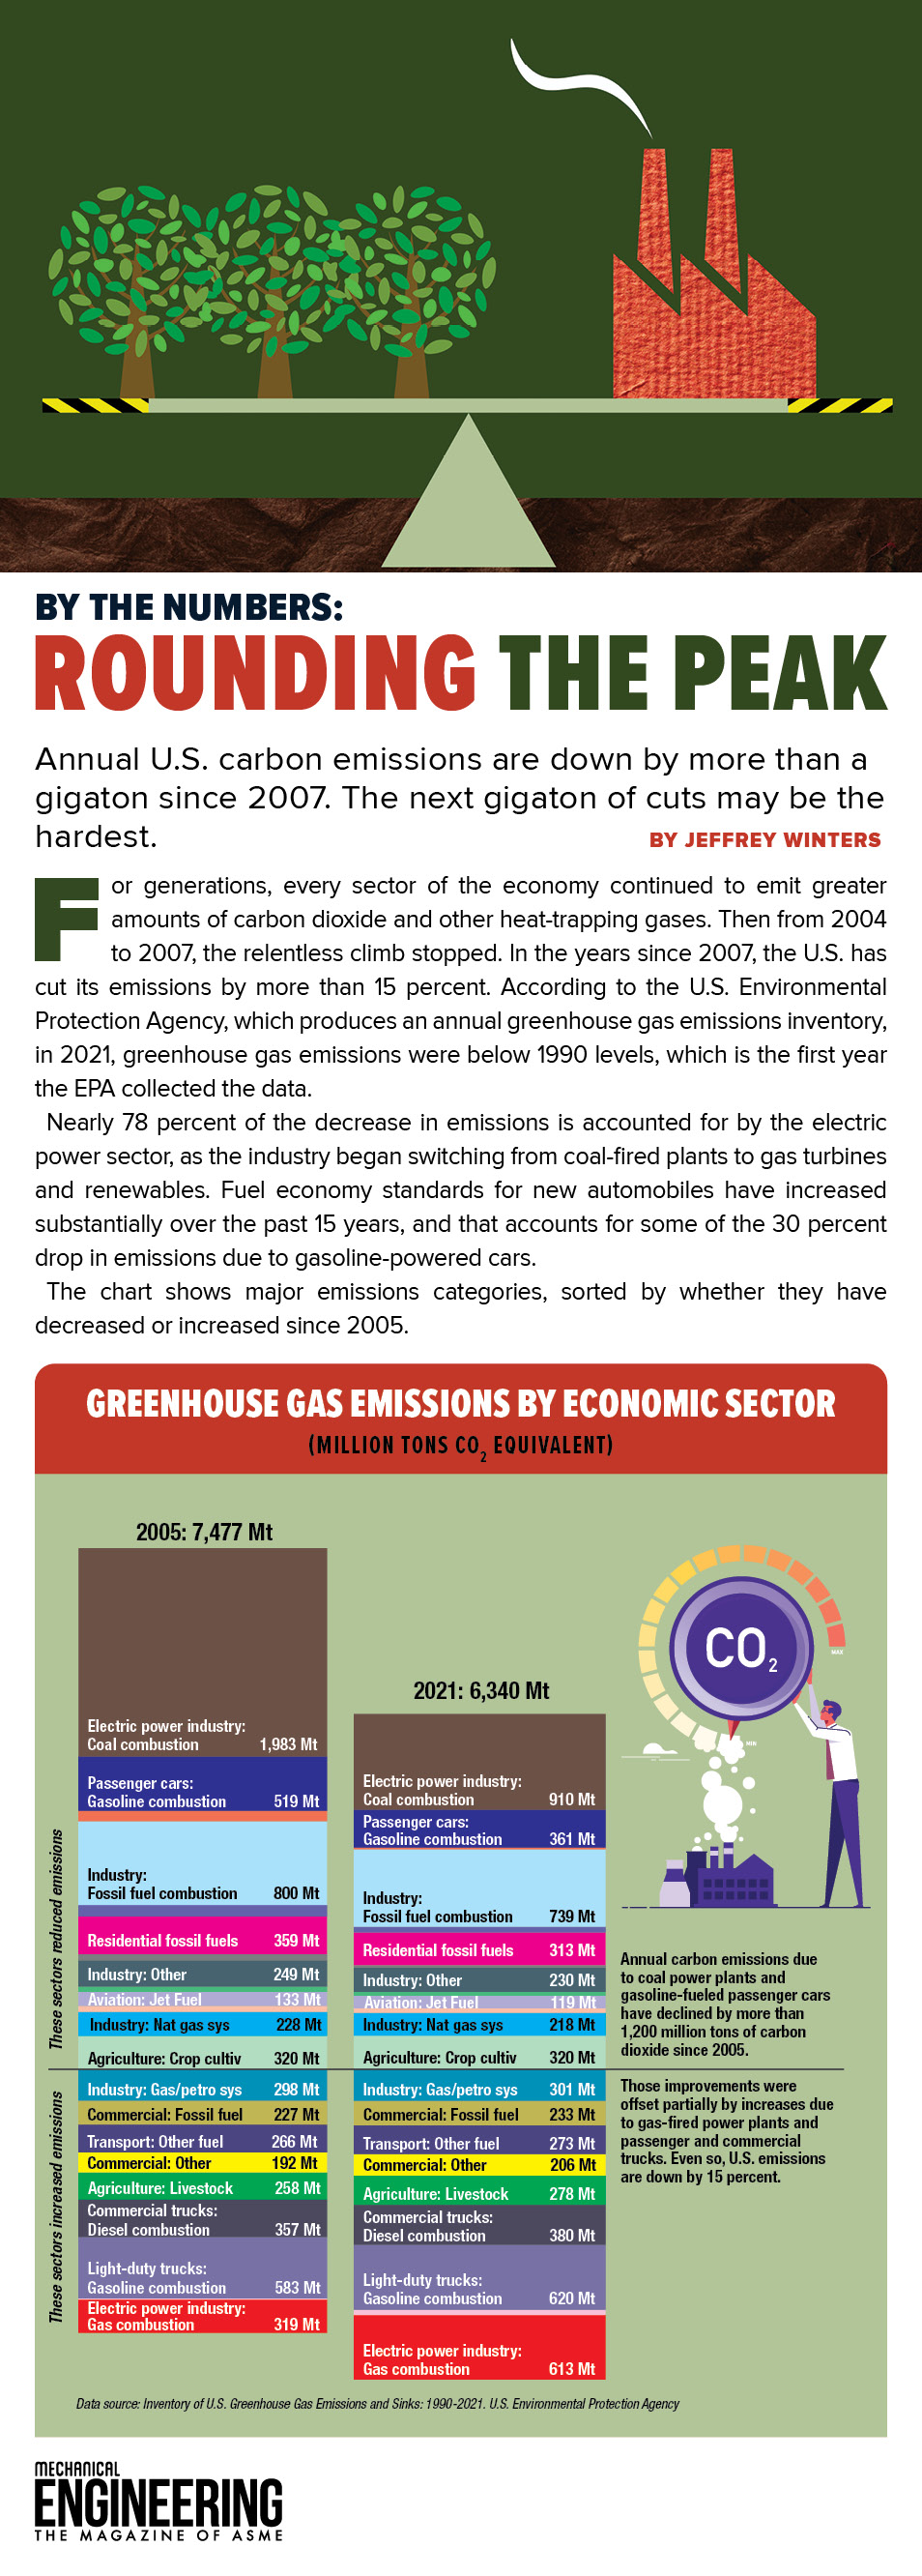
Annual U.S. carbon emissions are down by more than a gigaton since 2007. The next gigaton of cuts may be the hardest.
For generations, every sector of the economy continued to emit greater amounts of carbon dioxide and other heat-trapping gases. Then from 2004 to 2007, the relentless climb stopped. In the years since 2007, the U.S. has cut its emissions by more than 15 percent. According to the U.S. Environmental Protection Agency, which produces an annual greenhouse gas emissions inventory, in 2021, greenhouse gas emissions were below 1990 levels, which is the first year the EPA collected the data.
Nearly 78 percent of the decrease in emissions is accounted for by the electric power sector, as the industry began switching from coal-fired plants to gas turbines and renewables. Fuel economy standards for new automobiles have increased substantially over the past 15 years, and that accounts for some of the 30 percent drop in emissions due to gasoline-powered cars.
The chart shows major emissions categories, sorted by whether they have decreased or increased since 2005.
Related Content

Using Lasers to Produce Green Steel
Jan 22, 2025
To cut back on carbon emissions, companies are looking at new methods for producing steel in this excerpt from Mechanical Engineering magazine.

Infographic: Data Center Power Needs Escalate
Jan 21, 2025
As the number of data centers continues to grow exponentially, the need for more electricity to power them is climbing as well.
Fusion Research Receives $49 Million Boost
Jan 14, 2025
The projects will shift resources toward practical fusion power solutions, such as innovations in fusion reactor design, materials science, and plasma research.
A Moisture Wicking Battery
Jan 13, 2025
A new battery prototype transforms moisture from the environment into power.